The World Bank requires scatterplot depicting Life Expectancy (y-axis) and
Fertility Rate (x-axis) statistics by Country.
The scatterplot needs to also be categorized by Countries’ Regions.
we have been supplied with data for 2 years: 1960 and 2013 and we are required to produce a visualization for each of these years.
Some data has been provided in a csv file, some – in R vectors. The csv file contains
combined data for both years. All data manipulations must be performed in R (not
in excel) because this project may be audited at a later stage.
We have also been requested to provide insights of the Data comparison of two periods.
The data is provided to you in csv format
Please find the below Link for excel file(Demographic_data_population), download it in desktop to analyze the data.
https://sds-platform-private.s3-us-east-2.amazonaws.com/uploads/P2-Section5-Homework-Data.csv
And the Three vectors required to perform demographic analysis are provided by the company in Text file format (Vectors_data_2) attached below.
Copy the vectors from text file and paste in R script to work on this scenario
The three vectors used in our use case are:
Countries data
Country Codes
Regions
Step1: we are asked to produce a scatterplot illustrating depicting Life Expectancy (y-axis) and
Fertility Rate (x-axis) statistics by Country.
The scatterplot needs to also be categorized by Countries’ Regions.

First will import our excel data into R studio
Step2: The function we are using is read.csv ()
Source pane :
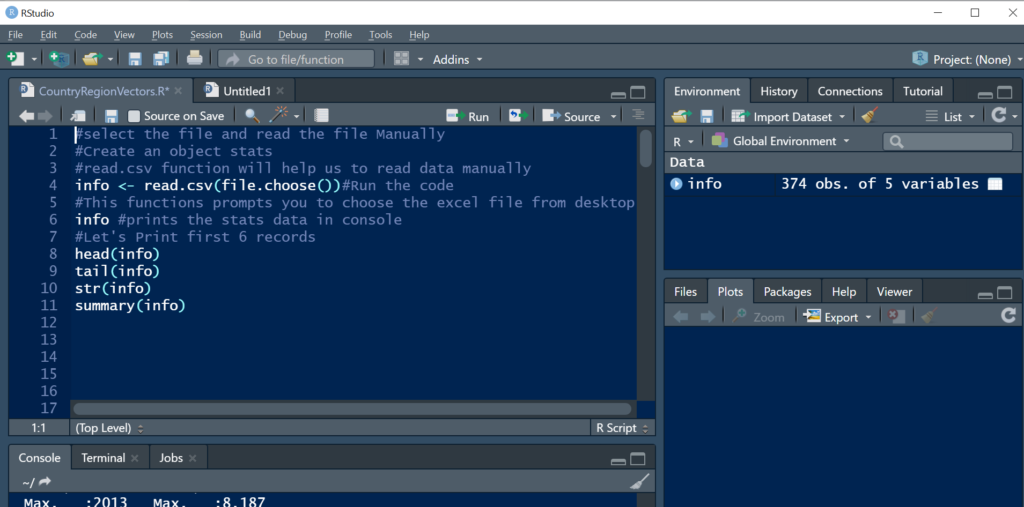
Here we Imported the excel file ,in the right side in environment pane we can see the data is loaded.
Let us try to understand the data :
head() – Displays the First 6 records
tail() – Displays the last 6 records
str() -Displays the Structure of Arbitrary Object
summary() -Displays the summary of the data
Console Pane :

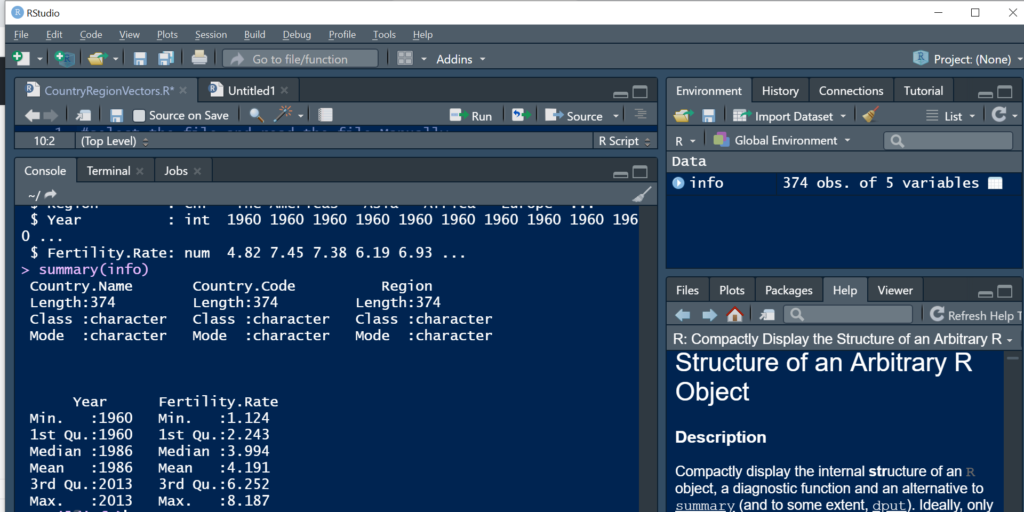
Step3: Let’s dig into More Insights of Data
Now Let’s see what is factor and Level
Factor :Factors are data structures which are implemented to categorize the data or represent categorical data and store it on multiple levels. They can be stored as integers with a corresponding label to every unique integer. Though factors may look similar to character vectors, they are integers and care must be taken while using them as strings.
Now i will Check the Factors for the Year Column:

Here we can see that data of the Year Column is shown as Factor(Encoded as Vectors)
Levels(): levels provides access to the levels attribute of a variable. The first form returns the value of the levels of its argument and the second sets the attribute .Technically, this function shows the Factor levels.
Now i will Check the Factor Levels for the Year Column:

Here the Levels of Year data are 1960 and 2013, the whole data for different countries are represented with two Years Data, That two years are shown as Levels of the Year Data.
Step4 : Filter the Dataframe
I require the data for the year 1960
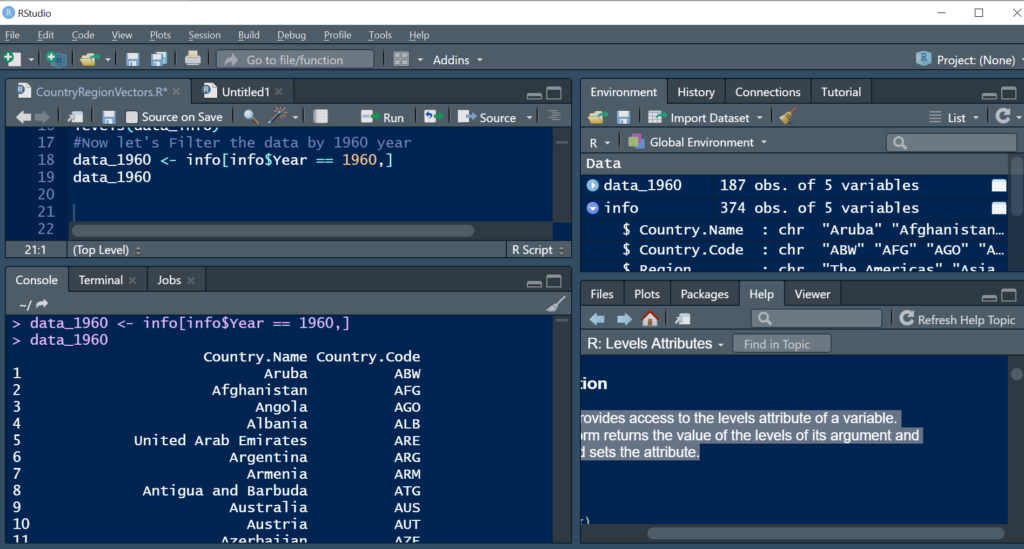
Here the data for 1960 Year is shown in console pane
Check the Number of Rows for 1960 year data:
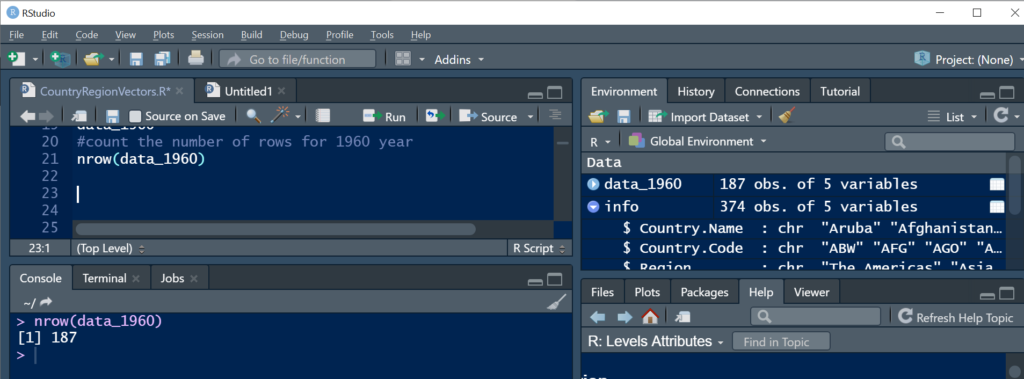
There are Total 187 records for 1960 Year.
Step5: Copy the three Vectors Provided in text File in R studio. (Three vectors data provided as text file attachment above)
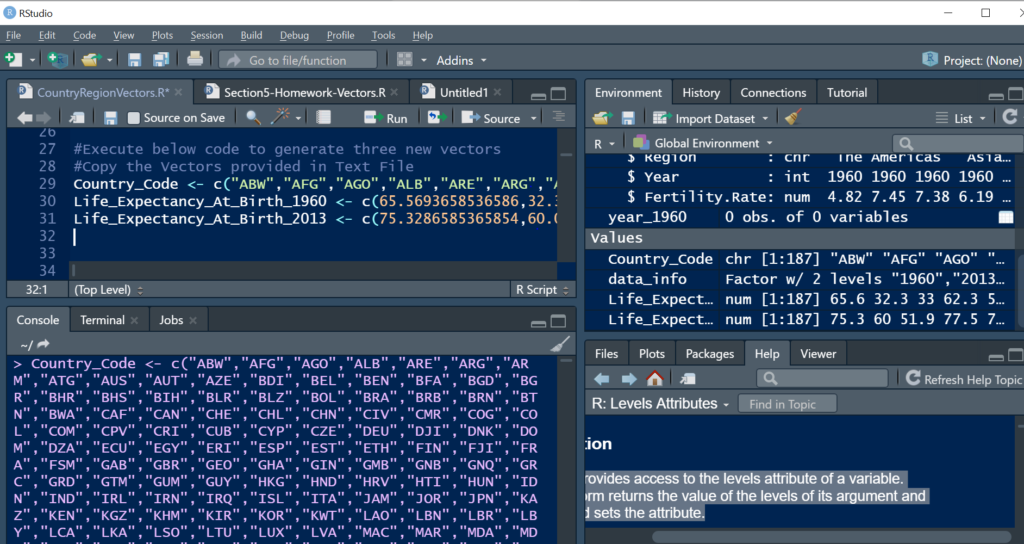
Creating Dataframes for these Vectors:
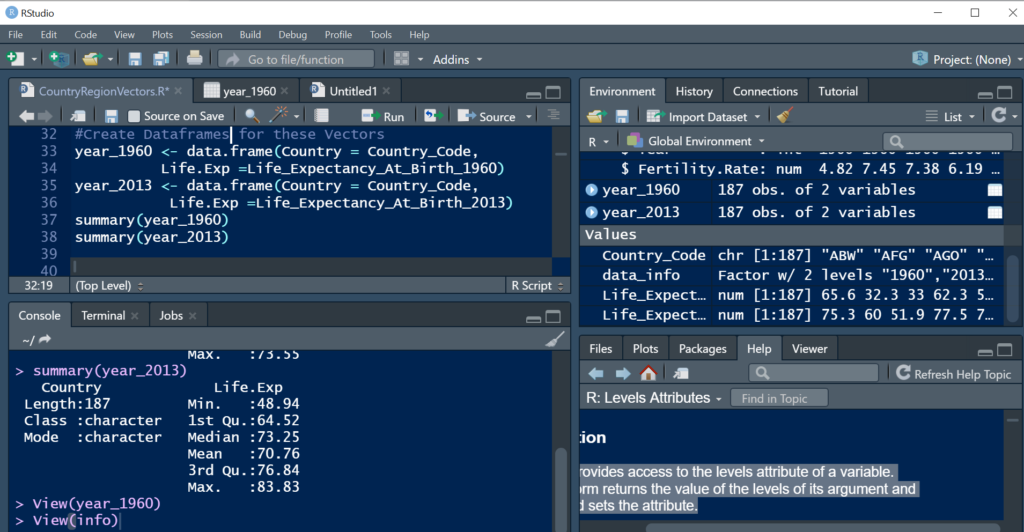
Here I have Created two Data frames for the vectors Country_Code, Life_Expectancy_At_Birth_1960 and Life_Expectancy_At_Birth_2013
and Name of the columns are changed to Country = Country_Code, Life.Exp = Life_Expectancy_At_Birth_1960 and Life_Expectancy_At_Birth_2013.

I Have merged the 1960 and 2013 years Data and removed the duplicate Data using unique Function
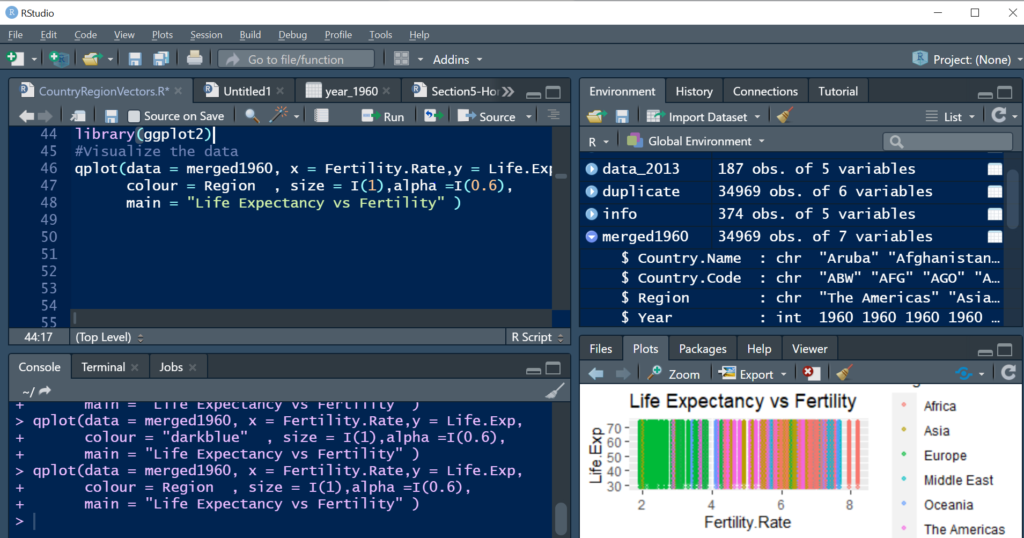
Using qplot the data is visualized by passing X axis = Fertility Rate, and Y axis = Life Expectancy and Title of the chart is passed to Main Aesthetics
