Assume that You are employed as a Data Scientist by the World Bank and you are working on a project to analyze the World’s demographic trends.
You are required to produce a scatterplot illustrating Birth Rate and Internet Usage statistics by Country.
The scatterplot needs to also be categorized by Countries’ Income Group
You have received an urgent update from your manager that You are required to produce a second scatterplot also illustrating Birth Rate and Internet Usage statistics by Country.
However, this time the scatterplot needs to be categorized by Countries’ Regions.
The demographic data is provided to you in csv format
Please find the below Link for excel file(P2-Demographic-Data), download it in desktop to analyze the data.
https://sds-platform-private.s3-us-east-2.amazonaws.com/uploads/P2-Demographic-Data.csv
And the Three vectors required to perform demographic analysis are provided by the company in Text file format (Vectors_data) attached below.
Copy the vectors from text file and paste in R script to work on this scenario
The three vectors used in our use case are:
- Countries data
- Country Codes
- Regions
Step1 : we are asked to produce a scatterplot illustrating Birth Rate and Internet Usage statistics by Country.
The scatterplot needs to also be categorized by Countries’ Income Group

First will import our excel data into R studio
Step2: The function we are using is read.csv ()
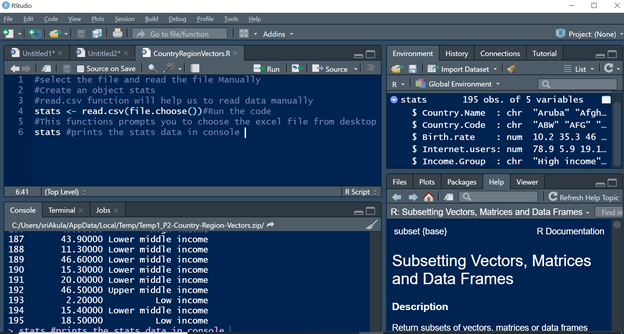
Here we can see the data is loaded in Right side Environment Pane, all the five columns data is imported from excel.
Step3: Now Let’s work on few Functions:
Head: Returns the first or last parts of a vector, matrix, table, data frame or function. Since head () and tail () are generic functions, they may also have been extended to other classes.
Will quickly see how this function works:
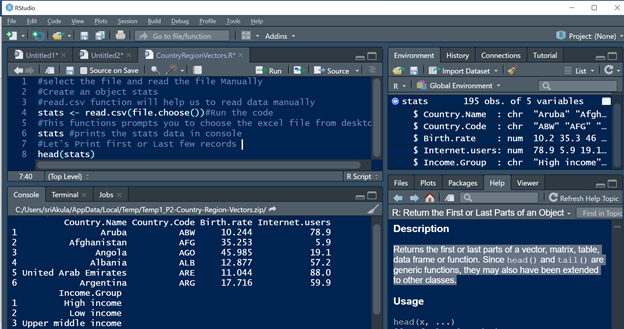
Here we can see this function prints first 6 records.
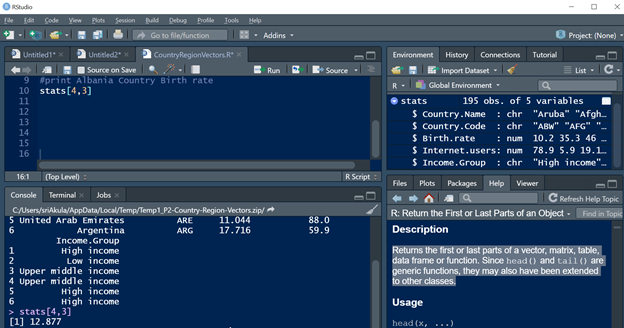
Now if we want to fetch the Albania Country Birth rate, which is our fourth record.
Syntax will be written like this:
Run the line10, the output is shown in console pane, it is 12.877
The same Birth rate for Albania Country is printed for the below syntax as well:

Use of $(dollar) Symbol:
The $ operator can be used to select a variable/column, to assign new values to a variable/column, or to add a new variable/column in an R object.
It fetches the entire Column Data.
Now let us see how this dollar operator works.
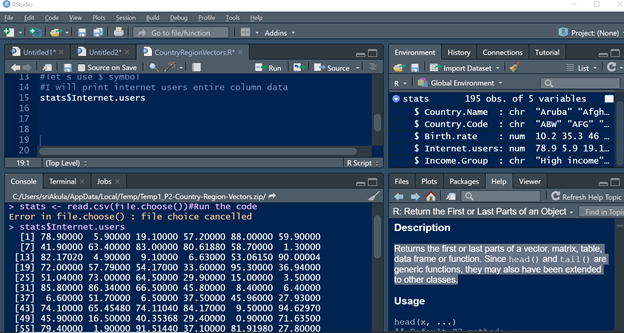
Here all the column data of internet users are printed.
Use of str Function ():
This Function Compactly Displays the Structure of an Arbitrary Object
This Compactly displays the internal structure of an object, in simple terms, it defines the summary of the object
Example:
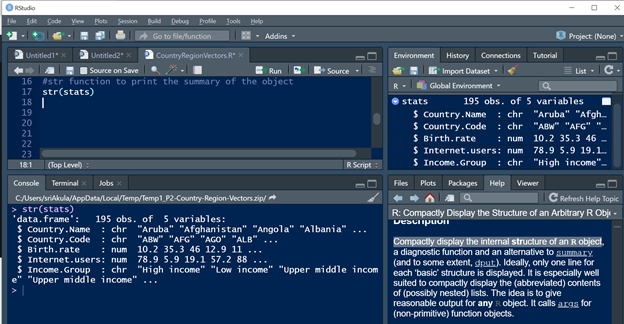
Here this function is printing the summary of the object
Looking at the summary data, as we are not that much clear about the level of the data shown here.
To see the column Level of data we use Function called levels ()
Use of levels () Function:
Levels provides access to the levels attribute of a variable. The first form returns the value of the levels of its argument and second sets the attribute.
We Will work on more functions in data frames and will solve this use case in the next post…. Keep Coding…. 😊